
In the spring I attended a workshop in San Mateo presented by Michael Fenton. The topic was problem solving and getting students to notice and wonder. I was using the data below in a lesson to my 8th grade math class the next Monday. I decided to makeover the lesson by starting with their “noticings and wonderings”.
I put up this scatterplot.

With Michael’s model, I asked students what they notice and what they wonder. Individually, in groups, as a class
My Math 8 class noticed and wondered.
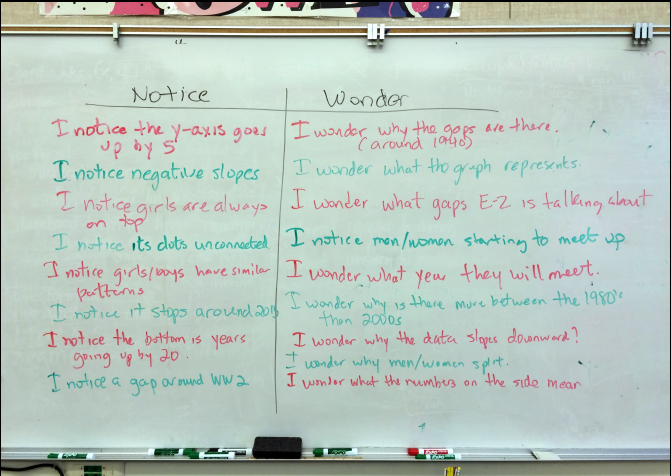
I hope it readable. They noticed the times decreasing, the women points getting closer to the men. The wondered why it was going down and what the numbers on the side mean. They listened to each other and were curious. EZ said he noticed some gaps and one around World War 2. Another student wondered what gaps EZ was talking about.
There will be speculation on Olympic events and there is a good chance someone will offer 100 meter free style. Once that is established, ask what questions they have. Their questions will generate a need for a model. In my math 8 classes, they all went to a linear model. Most pursuing the question, “will the girls time catch up to the boys time?” Others pursued how fast will the times be when they (the students) are my age. We have done that pursuit before. I tell them I was an entering 8th grade the summer of the 76 olympics.
There are some decisions to make. Do I give them a worksheet to guide them through the process? Ultimately I want a linear model from them. I want the answers to their questions with this model. I want them to think about whether the model always makes sense. I want them to make mistakes. Do I need a worksheet to generate that thinking? I gave them a copy of the graph.
I also give them a link to desmos and geogebra files with the data. Most use desmos. The ticket to the technology is that linear model. I am not sure if it would be better to hand them technology immediately.
I do want to give them the opportunity to make two particular mistakes. Many will make the mistake of counting the lines when determining the rate of change. They might have a slope of -½ or even ½ for the boys. If they come with a model first and then try it in desmos a mistake will be an opportunity for a moment of disequilibrium. Why did my line go up? Why isn’t it going down at the same rate? If they ask for my help, I am going to ask them what they like about their model and what do they wish they could change. I will ask them about their model and wonder what the parts have to do with swimming (What does your -½ or 65 have to do with swimming?) I will leave them thinking about that.
There is a second opportunity for a mistake that will lengthen the time needed for the lesson. You will have to judge its value to the learning. Should the data start at 1900 or should it start at 0 (with x being years since 1900)? Starting at 1900 is a certain opportunity for disequilibrium. They will test their equation in desmos and likely wonder if desmos is broken. They won’t see their graph. I will get them to zoom out and then they will see their line. I leave. If your students know point-slope form at this point they may avoid this mistake. I prefer to refer back to this data when we are working with point-slope form in order to motivate the value in learning a different form. If you do it before point-slope, it is a great opportunity for them to puzzle through how do they get their line back to zero. I have done it both ways and I would hate for them to miss the opportunity this error presents. On the other hand if the rate of change and slope is the key to this lesson, removing the error with the intercept helps focus this goal.
I have used this data many times over the years. A version was in the original CPM Algebra course. I have to thank Michael for the great addition with the “noticings and wonderings” at the beginning. The cost was a little in time and the gain was a much better grasp of the context needed to puzzle through the disequilibrium they were certain to encounter. We used it several times with other lessons since. I look forward to your thoughts as I am certain I will use this data again next year.
